Customer Insights
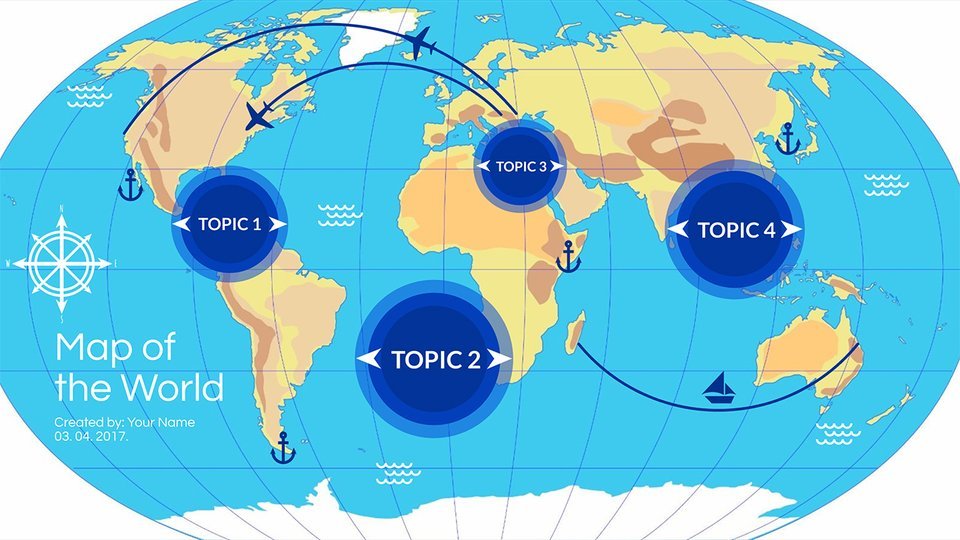
Transcript: Best used to show how something has evolved throughout time or to tell a story in a chronological order. Can be used to tell a brand story, historical development of things such as trends & products & others. Are accompanied by icons, images and other visual elements. Mixed Charts Malcolm Bugeja Darren Magri Andreas Willie Types of Infographics Represents location-based information. Can be presented by highlighting/shading parts of a map or overlaying shapes on top of the map. Infographics Informational Technically, if we go way back in time, infographics were firstly represented by cavemen when they drew on the walls. The earliest recorded forms of visualisation arose from the first maps. The fundamentals of measuring time, distance, surveying, map making and spacial geometry were formed & understood in the 1600s The last decade saw an outburst of infographics online. No sector was left untouched by this growth, from sports to marketing. Nowadays, infographics are evolving from just simply images to more interactive ways, such as animation and videos. History of Infographics (4) End of Presentation Next: Infographic Customer Insights The End Geographic Compares and contrast two or more things. Can highlight differences & similarities and pros & cons of the two or more things that are being compared. Serves as a guide for choosing between options. Made by: A type of long-form presentation which consists mostly of text and barely any visual elements. Enhanced with an appealing colour scheme and icons. History of Infographics Types of Infographics Original Animated Infographic History of Infographics (1) Content: Hierarchical Organizes information according to levels such as levels of importance, of difficulty, of income, etc.. Most common visualisations are pyramids or flow charts Key function is to compare or show the relationship between different levels. Timeline History of Infographics (2) add logo here Comparison Incorporates different graphs and charts Best type used when you have many statistics, facts and figures. By the end of the 17th century, most of the modern charts that we know today had been invented. William Playfair's seminal work, Commercial and Political Atlas, introduced the world to these new visual forms. History of Infographics (3) Throughout the years, infographics evolved more and more. The late 1900s saw an acceleration of computer aided data visualisation. With the aid of data visiualisation software, massive sets of data could be envisioned in complex forms.


