Balance Sheet
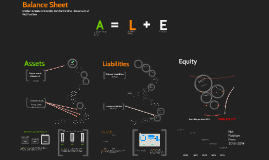
Transcript: Current Assets over the years $86,865,270 2014 2013 78.1% $85,902,496 $9,848,756 Capital Assets: accounts for 78 % of the Total Assets for the University. This includes property, movable or immovable, tangible or intangible, and fixed assets 2013 Restricted cash and cash Equivalents Accounts Liability: from 2013 to 2014 went up 26%. This account shows the amount a company owes for items or services purchased on credit and due withing one year $107,959,026 20.1 % Short-term investments: account for 21% of the Universities Total Assets for 2014. This account contains any investment that the University has made that will expire within one year $3,021,042 $0 2012 Net Position From 2010-2014 Scholarships and fellowships $0 It has a positive effect on net position, similar to Assets Claims Liability for losses and LEA $88,064,407 Non Current Assets 21.9% Leases receivable Liabilities Long-term debt obligations Other post-employment Benefit obligation Accounts Payable Noncurrent Assets Pledges receivable $3,944,050 Current Liabilities Non Current Liabilities $0 Grants refundable $218,460 Debt service 2014 $30,451,366 Other long-term investments Endowment Investment $0 Equity Total Net position 2014 $0 $54,473 Capitalized lease obligations 2012 Cash and cash equivalents $276,656,423 Capital assets $268,375,247 Also new to accounting Net investment in capital assets $55,599,557 Accrued compensated absences Loans Research $234,809 $211,504,932 Pledges receivable Other $0 Assets Other Liabilities $0 2014 E $0 Depository Accounts $413,310,808 $707,938 $0 $0 $3,021,042 This is an acquisition of net assets by the University that is applicable to a future reporting period Accounts receivable $0 Assets - this is the part of the balance sheet that represents the resources, that can be measured and can be expressed in dollars, that are owned by the University. Assets are made up of: Current Assets Non-Current Assets The Debt Ratio shows the University's ability to pay off its liabilities with its assets. Currently the University must sell 35 % of its assets to pay for its liabilities This is a consumption of Net assets by the University that is applicable to a future reporting period. This account sits in between Liabilities and Net Position Equity -represents the institution's interest in the assets of the University. The University's interest is the part of assets that is left after all liabilities are paid. Leases receivable 20.4% Unrestricted - Student loans receivable $1,437,112 Notes Receivable Other assets 2014 $90,664,114 Deferred Outflows of Resources Liabilities - are obligations and amounts owed to lenders and suppliers Liabilities are made up of Current Liabilities Non Current Liabilities $0 Capitalized Lease obligations $90,644,114 + $5,083,612 2012 $2,501,978 79.9% $0 $116,246,921 Long-term debt obligations Restricted for Nonexpendable -endowments 2013 Accounts receivable $3,021,042 Accrued compensated absences $565,212 California State University, San Bernardino -Statement of Net Position Accrued Salaries and benefits payable $285,716,469 $0 Short-term Investments $0 L $2,779,489 More than 1 year $16,733 Current assets Roughly New to Accounting This account sits after assets and before Liabilities. Unearned Revenue Capital projects Other Liabilities Claims liability for losses and LEA $2,235,675 $268,375,247 Accounts Liability From 2013 to 2014 2013 Depository accounts $296,149,215 $0 $3,450,004 Notes Receivable $1,042,375 $428,363 $277,183 Debt Ratio= Total Liabilities Total Assets $1,002,622 2010 It has a negative effect on net position, similar to Liabilities 79.6 A Expendable Unearned revenue = $320,607,099 Deferred inflows of Resources $0 $0 Balance Sheet $6,051,922 2011 1 year period $0 Current Assets $296,778,099 Prepaid Expenses and other assets


